As I have said before, taking notes is rife with danger. It’s so tempting to just write down everything that happens. But you probably can’t deal with all that data. First, it’s just too much. Second, it’s not organized.
Let’s look at an example research question: Do people make more errors on one version of the system than the other?
And we chose these measures to find out the answer:
- Count of all incorrect selections (errors)
- Count and location of incorrect menu choices
- Count and location of incorrect buttons selected
- Count of errors of omission
- Count and location of visits to online help
- Number and percentage of tasks completed incorrectly
Here’s what I did.
First, I listed the page (sometimes I put in a screen shot), with the correct action and then the possible (predictable, known) errors, like this:
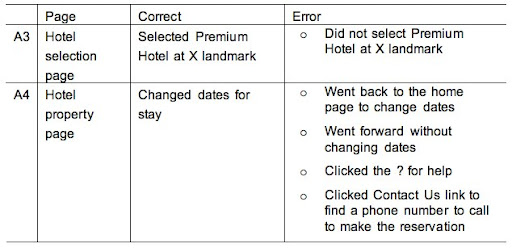
I hope you can see how to turn this into a pick list. You can just check these items off or number them if people do more than one of the errors. For my note taking forms, I added a choice for “Other” in case something happened that I hadn’t anticipated.
Here’s another image (below) from a different study, but you get the idea: This is what your notes end up looking like.

Even if you’re not doing statistical analyses, it’s easy to hold up these pages together across participants to see how many had problems and how severe the problems were.