Design teams often need results from usability studies yesterday. Teams I work with always want to start working on observations right away. How to support them while giving good data and ensuring that the final findings are valid?
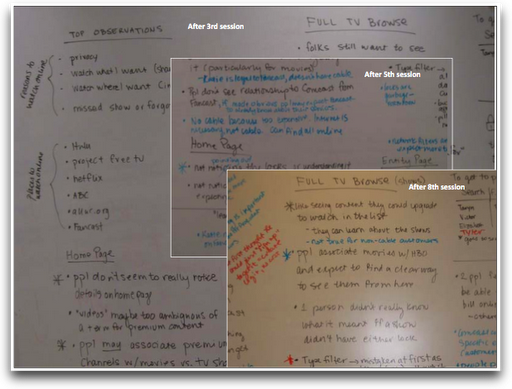
Teams that are fully engaged in getting feedback from users – teams that share a vision of the experience they want their users to have – have often helped me gather data and evaluate in the course of the test. In chatting with Livia Labate, I learned that the amazing team at Comcast Interactive Media (CIM) came to the same technique on their own. Crystal Kubitsky of CIM was good enough to share photos of CIM’s progress through one study. Here’s how it works:
1. Start noting observations right away
After two or three participants have tried the design, we take a longer break to debrief about what we have observed so far. In that debrief, each team member talks about what he or she has observed. We write it down on a white board and note which participants had the issue. The team works together to articulate what the observation or issue was.
2. Add observations to the list between sessions
After each succeeding session, as the team generates observations, I add observations to that list, including the numbers for each participant who had the issue. We note any variations on each observation – they may end up all in one, or they may branch off, depending on what else we see.
Here’s an example observation from one study. We noted on the first day of testing that:
Participants talked about location, but scrolled past the map without interacting with it to get to the search results (the map may not look clickable)
The team and I later added the participant numbers for those who we observed doing this:
Participants talked about location, but scrolled past the map without interacting with it to get to the search results (the map may not look clickable) PP, P1, P3
Each day of testing, the team and I add more observations and more participant numbers.
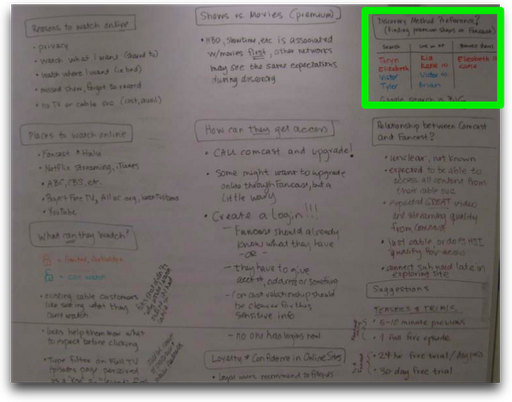
The CIM team debriefs to review top observations, highlighting what they learned and color-coding participants or segments as they capture rolling observations:
3. Invite team member observers to add observations to the list themselves
As the team gets better at articulating the issues they have seen in a test session, it is my experience that they start adding to the list on their own. Often one of the observers voluntarily takes over adding to the list. This helps generate even more buy-in from the team and means that I can concentrate on focusing the discussion on the issues we agreed to explore when we planned and designed the test.
At the end of the last session, it’s easy then to move to a design direction meeting because the team has observed sessions, articulated issues, and already analyzed that data together.
The CIM team documents which participants had which behaviors in the table at the top right of the photo above.
What makes it a “rolling” list of observations and issues?
There are three things that are “rolling” about the list. First, the team adds issues to the list as they see new things come up (or that you didn’t notice before, or seemed like a one-off problem). Second, the team adds participant numbers for each of the issues as the test goes along. Third, the team refines the descriptions of the issues as they learn more from each new participant.
Double-check the data, if there’s time
Unless the team is in a very rapid, iterative, experimental mode, I still go back and tally all of the official data that I collected during each session. I want to be sure that there are no major differences between the rolling issues list and the final report. Usually, the rolling issues list and the final data match pretty closely because the team took care in defining the research questions and issues to explore together when we planned and designed the test.
Doing the rolling list keeps teams engaged, informed, and invested. It helps the researcher cross-check data later, and it gives designers and developers something to work from right away.


Shout-out to the researchers on the CIM UX team who make all this good stuff happen: Crystal Kubitsky, Liz Kell, Kellie Carter and our interns Cleonie Meraz and Alisa Conte!As someone who is not directly involved with the research projects but tries to attend at least one user session for all, I have to say that having the daily debriefs and rolling observations on the wall really make it very easy to understand the context and what kinds of insights are being gathered.
Not only do the rolling observations help to provide easier to understand context for stakeholders, they also really help us to come to our insights more quickly.Insights from our research efforts are always needed yesterday, rolling observations help us to be more effective at delivering faster.
A great article indeed and a very detailed, realistic and superb analysis, of this issue, very nice write up, Thanks.
One thing I have found useful is to do it as a spreadsheet, with the issue, then columns for each participants. We score a “1” for a minor issue, “3” for a major one. One more column for the auto-calculated total.
Also, a separate table for positive findings.
After the sessions are done, we do a sort on the issues table and positive table, and bingo – we have the top issues and wins to email to stakeholders. Done!