Let’s say you’re looking at these behaviors in your usability test:
- Where do participants start the task?
- How easily do participants find the right form? How many wrong turns do they take on the way? Where in the navigation do they make wrong turns?
- How easily and successfully do they recognize the form they need on the gallery page?
- How well do participants understand where they are in the site?
How does that turn into data from which to make design decisions?
What counts?
It’s all about what counts. What did the team observe that shows that these things happened or did not happen?
Say the team does 10 individual usability test sessions. There were 5 major “scavenger hunt” tasks. Everyone has their own stack of yellow stickies that they’ve written down observations on. (Observations of behavior, only – there should be no interpreting, projecting, guessing, or inferring yet.) Or, say the team has kept a rolling issues list. All indications are that the team is in consensus about what happened.
Example 1: Entry points
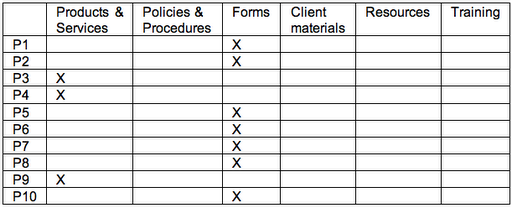
Here’s an example. For the first task, Find an account open form, the first thing the team wanted to observe for was whether participants started out where we thought they should (Forms), and if not, where participants did start.
The data looked like this:
Seven of the 10 started out at Forms – great. That’s what the team expected based on the outcomes of card sorts. But 3 participants didn’t. But those 3 all started out at the same place. (First inference: Now the team knows there is strong scent in one link and some scent in another link.)
Example 2: Tracking navigation paths – defining “wrong turn”
Now, what about the wrong turns? In part, this depends on how the team defines “wrong turn.”
What you’re finding out in exploratory tests with early designs is where users go. Is that wrong? Not necessarily. Think of it in the same way that some landscapers and urban planners do about where to put walkways in a park. Until you can see where the traffic patterns are, there’s not a lot of point in paving. The data will tell you where to put the paths outside where the team projects the path should be.
As each session goes on, the team tracks where participants went. The table below actually tracks the data for multiple issues to explore:
- How many wrong turns do they take on the way?
- Where in the navigation do they make wrong turns?
- How easily and successfully do they recognize the form they need on the gallery page?
Everyone ended up at the right place. Some participants even took the path that the team expected everyone to take: Forms / Account Open / Form #10.
But the participants who started out at Products had to go back to the main navigation to get to the right place. There’s a decision to make. The team could count those as “wrong turns” or they could look at them as a design opportunity. That is, the team could put a link to Forms on the Product page – from the point of view of the user, they’re still on the “right” path and the design has prevented the user from making a mistake.
Account Open is a gallery page. Kits is the beginning of a wizard. Either way, the right form is available in the next step and all the participants chose the right one.
Measures: Everything counts
So, how do you count what counts? The team counted errors (“wrong turns”) and task successes. How important are the counts? The team could have gone with their impressions and what they remembered. There’s probably little enough data to do that. In smaller tests, your team might be comfortable with that. But in larger tests – anything over a few participants – observers typically remember the most recent sessions the best. Earlier sessions either fade in memory or the details become fuzzy. So tracking data for every session can keep the whole team honest. When there are numbers, the team can decide together what to do with them.
What we saw
This team learned that we got the high-level information architecture pretty close to right – most participants recognized where to enter the site to find the forms. We also learned that gallery pages were pretty successful; most participants picked the right thing the first or second time. It was easy to see all of this in tracking and counting what participants did.

